Condominium Market Snapshot - Feb 2019 - graph 1

Historical Brickell Prices & Rents – Feb 2019

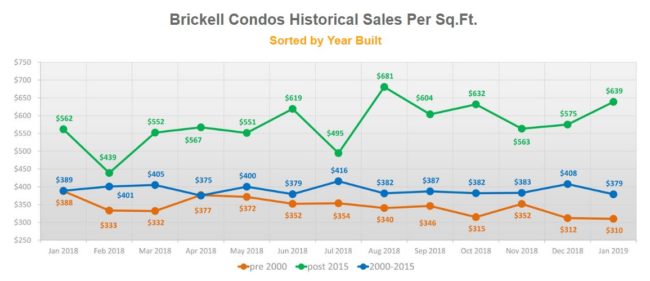
[vc_row][vc_column][vc_single_image image=”203″ img_size=”large” alignment=”center” onclick=”link_image”][vc_single_image image=”206″ img_size=”large” alignment=”center” onclick=”link_image”][vc_column_text]Graphs above compare historical trends of sold prices and rents per-square-foot for Brickell condominiums separated by year when buildings were built. We created 3 main categories: Buildings completed before year 2000, from 2000 to 2015, and after 2015. You can observe significant average price difference between fairly…

Condominium Market Snapshot - Feb 2019 - Main Table

Condominium Neighborhood Market Data – Feb 2019

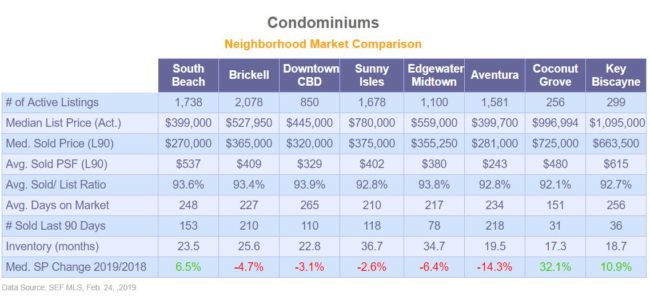
[vc_row][vc_column][vc_single_image image=”195″ img_size=”large” alignment=”center” onclick=”img_link_large”][vc_column_text]There has been an uptick in a number of active condominium listings across the board with a sole exception of South Beach. The largest inventory increase of 7.3% was observed in Sunny Isles which just surpassed 3 years at 36.7 months. Inventory is calculated by dividing the number of active listings…

Single Family Market Snapshot - Feb2019

Single Family Neighborhood Market Data – Feb 2019

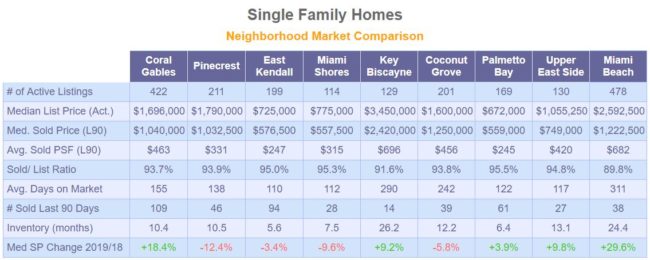
[vc_row][vc_column][vc_single_image image=”223″ img_size=”large” alignment=”center” onclick=”link_image”][vc_column_text]Data Source: SEF MLS, Feb. 15, 2019 Amount of active listings in February increased across all surveyed neighborhoods above by an average of 6.2% with a largest increase in Key Biscayne with a jump of 11.2%. Most significant increases in median asking prices from previous month are in East Kendall (7.4%)…

coral-gables-median-SP-2018-feb2019

Coral Gables & Coconut Grove Sales

[vc_row][vc_column][ultimate_heading main_heading=”Coral Gables & Coconut Grove Sales” heading_tag=”h3″ margin_design_tab_text=””][/ultimate_heading][vc_empty_space height=”16px”][vc_single_image image=”214″ img_size=”large” alignment=”center” onclick=”img_link_large”][vc_single_image image=”215″ img_size=”large” alignment=”center” onclick=”img_link_large”][/vc_column][/vc_row][vc_row][vc_column][vc_column_text]Data Source: SEF MLS, Feb. 15, 2019 Above graphs depict number of closings each month and median sale price in Coral Gables and Coconut Grove from January 2018 to January 2019.[/vc_column_text][/vc_column][/vc_row]