Skip to content
786.471.7287info@biscaynere.com
Facebook page opens in new windowLinkedin page opens in new windowInstagram page opens in new windowYelp page opens in new window
Biscayne Real Estate
Beyond real estate
Biscayne Real EstateBiscayne Real Estate
  • Home
  • Property Search
    • Single Family Homes
    • Condominiums
    • Residential Rental
    • Commercial
  • Services
    • Residential Services
    • Commercial Services
    • Investment & Advisory Services
  • About us
    • Newsletter Sign Up
    • Frequently Asked Questions
    • Resources
  • Blog
  • Contact us
Search:
Search
  • Home
  • Property Search
    • Single Family Homes
    • Condominiums
    • Residential Rental
    • Commercial
  • Services
    • Residential Services
    • Commercial Services
    • Investment & Advisory Services
  • About us
    • Newsletter Sign Up
    • Frequently Asked Questions
    • Resources
  • Blog
  • Contact us

Yearly Archives: 2019

You are here:
  1. Home
  2. 2019

email-blast-header---may-2019-single-family-homes

Single Family Market Update – May 2019

Market Research, Residential Real EstateBy BiscayneREMay 21, 2019

Single FamilyNeighborhood Comparison Data Source: SEF MLS, May 20, ,2019 Inventory levels continue to steadily increase across all surveyed neighborhoods. Following 2 numbers behind each neighborhood represent inventory level as of October of 2018 and inventory level as of May of 2019: Coral Gables (9.2 months, 12.5 months), Pinecrest (10.4 months, 12.5 months), East Kendall…

email-blast-header---APRIL-2019-condominiums

Condominium Market Update – April 2019

Market Research, Residential Real EstateBy BiscayneREMay 4, 2019

CondominiumNeighborhood Comparison Data Source: SEF MLS, April 22, ,2019 Number of active listings peaked around the end of last year and beginning of this year and has since dropped in all surveyed neighborhoods with the sole exception of Edgewater. Most notable decrease was in South Beach where the number of available condominiums dropped by 6.3%…

email-blast-header---april-2019-single-family-homes

Single Family Market Update – April 2019

Market Research, Residential Real EstateBy BiscayneREApril 16, 2019

Single FamilyNeighborhood Comparison Data Source: SEF MLS, April 14, ,2019 Let’s start from the bottom of the table and look at inventory levels first. To calculate this number I am using number of sales in the last 365 days, dividing it by 12 to derive at average monthly sales velocity. Then I take an available…

email-blast-header---MARCH-2019-condominiums

Condominium Market Update – March 2019

Market Research, Residential Real EstateBy BiscayneREMarch 28, 2019

CondominiumsNeighborhood Comparison Data Source: SEF MLS, Mar. 19, ,2019 The largest increase of median sale price in 3-month trailing period year-over-year (Dec-Feb) has been observed in Coconut Grove (15.3%), followed by Key Biscayne (10.6%), and South Beach (8.9%). On the opposite side in the red is Aventura (-12.9%), Edgewater/ Midtown (6.9%), and Downtown/ Central Business…

email-blast-header---MARCH-2019-single-family-homes

Single Family Market Update – Mar 2019 (Cont’d)

Market Research, Residential Real EstateBy BiscayneREMarch 14, 2019

Data Source: SEF MLS, Mar. 13, 2019 All five surveyed neighborhoods above continue to display decent growth especially the front-runners Little Haiti and Allapattah. Opa Locka and Hialeah lag behind but overall low inventory levels, ongoing strong sales velocities, and high sale/list ratios still make these good investment prospects.

email-blast-header---MARCH-2019-single-family-homes

Single Family Market Update – Mar 2019

Market Research, Residential Real EstateBy BiscayneREMarch 14, 2019

Data Source: SEF MLS, Mar. 11, 2019 First, I would like to address a question I have been asked a number of times recently: Why is there such a discrepancy between between Median List Price and Median Sold Price? The answer is that the pricing spectrum or distribution of available properties does not correspond to…

Condominium Market Snapshot - Feb 2019 - graph 1

Historical Brickell Prices & Rents – Feb 2019

Market Research, Residential Real EstateBy BiscayneREFebruary 27, 2019

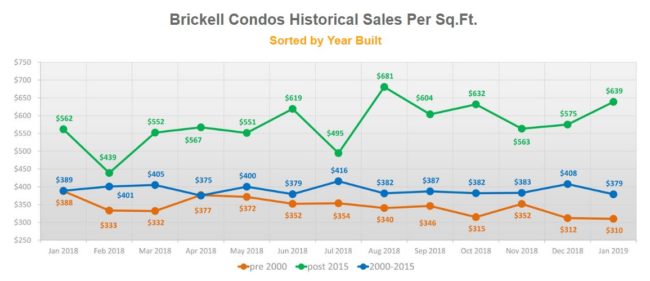
Graphs above compare historical trends of sold prices and rents per-square-foot for Brickell condominiums separated by year when buildings were built. We created 3 main categories: Buildings completed before year 2000, from 2000 to 2015, and after 2015. You can observe significant average price difference between fairly newly delivered properties and 2 other groups. Overall,…

Condominium Market Snapshot - Feb 2019 - Main Table

Condominium Neighborhood Market Data – Feb 2019

Market Research, Residential Real EstateBy BiscayneREFebruary 27, 2019

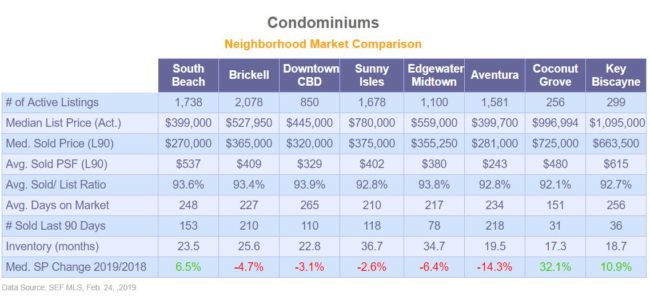
There has been an uptick in a number of active condominium listings across the board with a sole exception of South Beach. The largest inventory increase of 7.3% was observed in Sunny Isles which just surpassed 3 years at 36.7 months. Inventory is calculated by dividing the number of active listings by a number of…

Single Family Market Snapshot - Feb2019

Single Family Neighborhood Market Data – Feb 2019

Market Research, Residential Real EstateBy BiscayneREFebruary 15, 2019

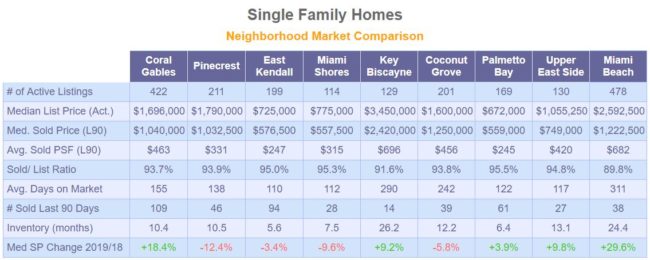
Data Source: SEF MLS, Feb. 15, 2019 Amount of active listings in February increased across all surveyed neighborhoods above by an average of 6.2% with a largest increase in Key Biscayne with a jump of 11.2%. Most significant increases in median asking prices from previous month are in East Kendall (7.4%) and Upper East Side…

coral-gables-median-SP-2018-feb2019

Coral Gables & Coconut Grove Sales

Market Research, Residential Real EstateBy BiscayneREFebruary 15, 2019

Coral Gables & Coconut Grove Sales Data Source: SEF MLS, Feb. 15, 2019 Above graphs depict number of closings each month and median sale price in Coral Gables and Coconut Grove from January 2018 to January 2019.

←123→
Biscayne Real Estate

© 2022 Biscayne Real Estate | Site by Yakadanda

  • Privacy Policy
  • Terms & Conditions
  • Fair Housing Pledge
Footer Menu
Go to Top