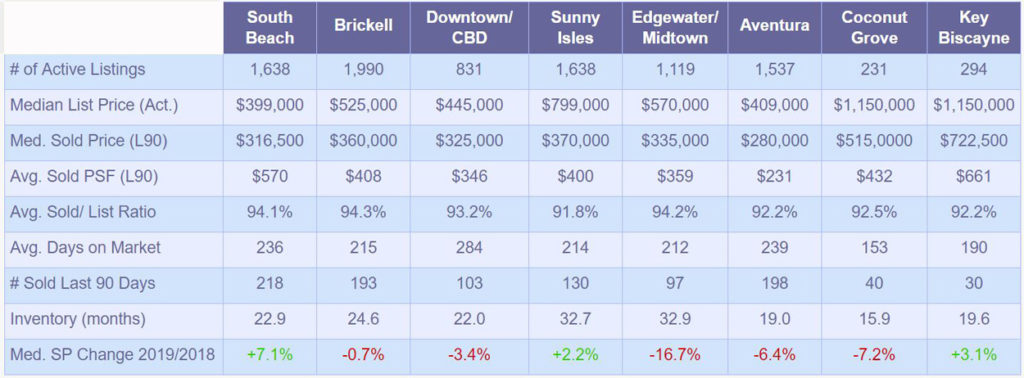
Data Source: SEF MLS, April 22, ,2019
Number of active listings peaked around the end of last year and beginning of this year and has since dropped in all surveyed neighborhoods with the sole exception of Edgewater. Most notable decrease was in South Beach where the number of available condominiums dropped by 6.3% – from the 1,749 in January 2019 to 1,638 in April. Edgewater active listing inventory is up 11.5% from October of last year. Median asking price increased in all markets except South Beach and Brickell compared to last month. This does not necessarily mean that more expensive properties are being listed or asking prices of the listed properties are being increased. As can be observed in the row below, the median sale price (middle value of sold units spectrum) is significantly below the median listing price (middle value of available units). As a matter of fact, Coconut Grove L90 median sale price measures at merely 44.8% of median listing price, followed by Sunny Isles at 46.3%. On the opposite side we will find Downtown Miami with 73.0% and South Beach with 79.3%. So back to my explanation about increased listing price, as lower priced properties are sold and pulled out of the available properties pool, median value of the remaining properties will raise correspondingly unless there is a sufficient number of new properties listed at similar price range as the ones that were sold.
Comparing the median sale price in the last 90 days (Jan-Mar 2019) to median sale price in a period Jul-Sept 2018, largest increase took place in South Beach at 25.1% (from $253,000 to $316,500) and largest decline in Sunny Isles at 17.8% (from $450,000 to $370,000).


