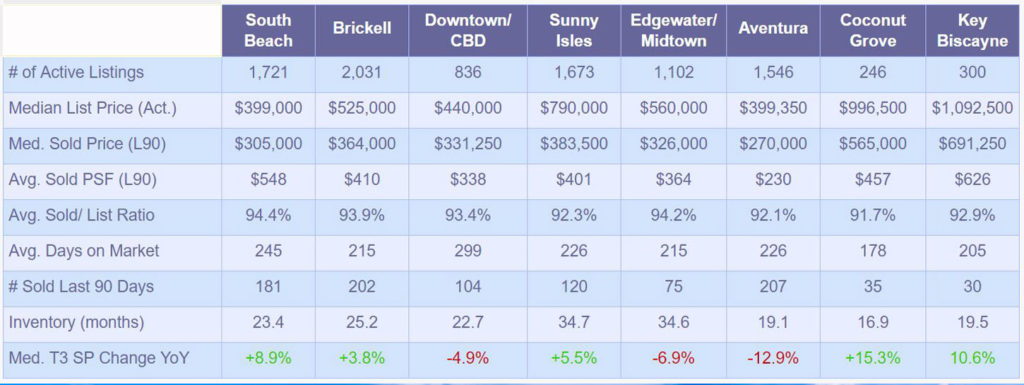
Data Source: SEF MLS, Mar. 19, ,2019
The largest increase of median sale price in 3-month trailing period year-over-year (Dec-Feb) has been observed in Coconut Grove (15.3%), followed by Key Biscayne (10.6%), and South Beach (8.9%). On the opposite side in the red is Aventura (-12.9%), Edgewater/ Midtown (6.9%), and Downtown/ Central Business District (4.9%).
Inventory level increased the most in South Beach by 3.2 months to 23.4 months compared from 4 months ago and decreased the most Downtown Miami by 2.7 months to 22.7 months.
In case you have not read our last Single Family Report in which I addressed a large discrepancy between Median List Price and Median Sale Price, the explanation is that the pricing spectrum or rather a distribution of pricing for available properties does not correspond to the pricing range of sold properties. For example, in South Beach, 78% of available condominiums are priced under $1M but the ratio of those sold in the last 90 days is 86%.


