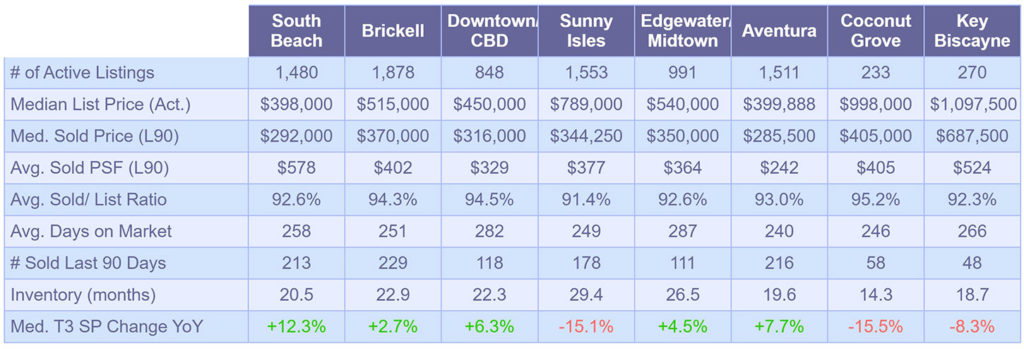
Data Source: SEF MLS, October 23, 2019
Most notable changes of available condominiums for sale took place in Coconut Grove where the number of available units increased by +9.4% to 233 and Edgewater where it decreased by -2.3% to 991.
We show the changes of available units for sale (above) but also inventory levels (bellow) which is calculated as how many months it would take to sell off currently available units. In our scenario we use a number of sale per month calculated from the number of total sales which took place in the last 12 months to avoid seasonal fluctuations.
Inventory levels decreased most significantly in Edgewater (1.6 months or 5.7%) and Key Biscayne (1.1 months or 5.6%). Comparing the current levels to November of 2018, five out of eight surveyed neighborhoods have lower inventories with other three increasing by less than 1 month (South Beach, Aventura, and Key Biscayne).
Comparing the current median asking prices to October of last year, Downtown Miami edged up by 4.7% to $450,000 while Edgewater slipped by 5.3% to $540,000.
Last 90-day Median Sale Prices appear most alarming in Sunny Isles where the median sale price plummeted by -15.1% to $344,250 compared to data from October of 2018 and in Coconut Grove with a drop of -15.5% to $405,000. 2019 year-to-date data compared to 2018 look slightly better but still grim setting the median sale price drop for Sunny Isles at -7.4% and Coconut Grove at -8.9%. South Beach had a downward trajectory since March of this year but compared to median sale price a year ago, at $292,000 it is up by +15.4%.
Sign up for our Monthly Market Snapshot here or contact us further information


12 Comments