Data Source: SEF MLS, Mar. 11, 2019
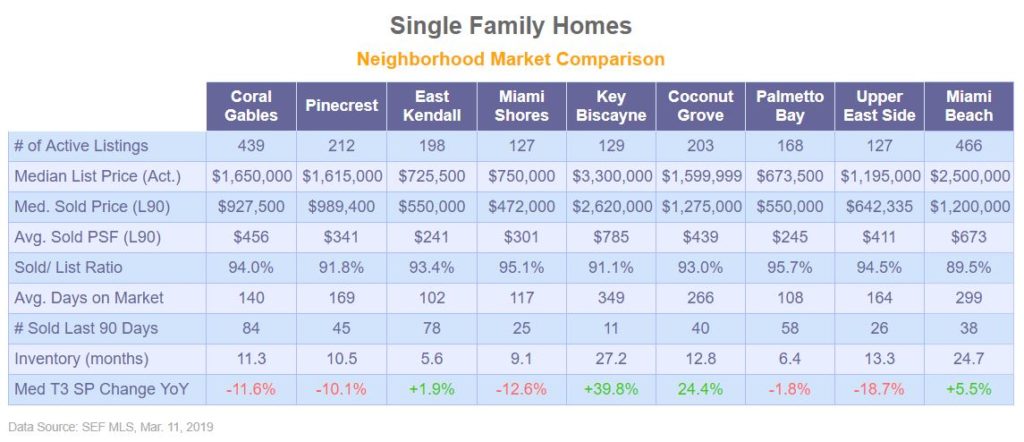
First, I would like to address a question I have been asked a number of times recently: Why is there such a discrepancy between between Median List Price and Median Sold Price? The answer is that the pricing spectrum or distribution of available properties does not correspond to the range of sold properties. For example Coral Gables has 439 single family homes available ranging from $375K to $68M. Of these, 54 or 12.3% are priced over $5M resulting in average listing price of $3.38M but median listing price of only $1.65M, a big difference right? For a uneven price distribution the median value is a better indicator to track over the average value. Moving on to the sold data for Coral Gables, of the 84 single family homes sold in the last 90 days, only 5 or 6.0% were over $5MM with the lowest at $350K and the highest at $11.5M. This results in Median Sale Price of $927,500 and average sale price of $1,576,952.
The last row Median Price Change has changed slightly since the last month’s report. We previously used year-to-date data and compared it the previous year but since limited sales velocities in certain neighborhoods did not illustrate pricing changes properly we now use sales data for the last 3 months (Dec 1, 2018 – Feb 28, 2019) and calculate the increase or decrease in Median Sale Price over the same period prior year.


