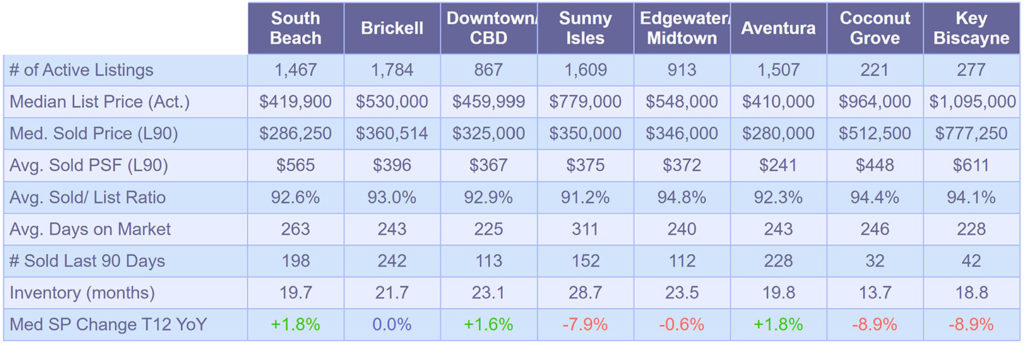
Inventory levels continue to decline across all markets compared to the previous month. Edgewater once again decreased its inventory level by almost 2 months from December 2019 and by almost 11 months from a year ago. Significant inventory level drops also took place in South Beach and Sunny Isles Beach where time to sell current inventory would take 19.7 and 28.7 months respectively. The neighborhood with the tightest market inventory continues to be Coconut Grove with 13.7 months of condominium supply.
Some of you might have noticed that since my first report about a year ago I have changed the time period in the last row of the table above in which I to collect sales data in order to calculate any changes in median sale prices. Neighborhoods with low sales volumes might tend to provide inaccurate picture especially at the beginning of the year if calculated on the calendar year basis. I, therefore, made the adjustment to calculate the changes on trailing 12-month basis year-over-year meaning the median sale price in the last 12 months is compared to the median sale price of the previous 12-month period. In addition, I compare trailing 3-month median sale price as well as the average price per square foot which if needed will be addressed below the table here.
Data Source: SEF MLS, January 27-28, 2020
Sign up for our Monthly Market Snapshot here or contact us for further information.


16 Comments