email-blast-header---MARCH-2019-single-family-homes

Single Family Market Update – Mar 2019

[vc_row][vc_column][vc_single_image image=”316″ img_size=”large” alignment=”center” onclick=”link_image”][vc_column_text]Data Source: SEF MLS, Mar. 11, 2019 First, I would like to address a question I have been asked a number of times recently: Why is there such a discrepancy between between Median List Price and Median Sold Price? The answer is that the pricing spectrum or distribution of available properties…

Condominium Market Snapshot - Feb 2019 - graph 1

Historical Brickell Prices & Rents – Feb 2019

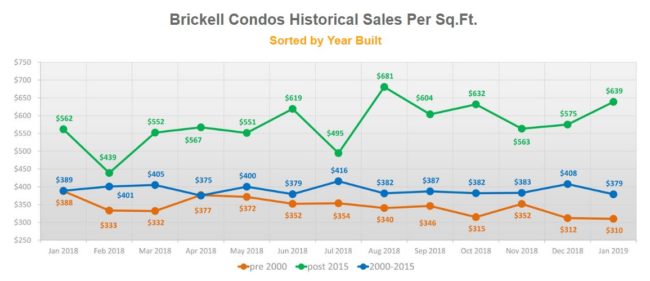
[vc_row][vc_column][vc_single_image image=”203″ img_size=”large” alignment=”center” onclick=”link_image”][vc_single_image image=”206″ img_size=”large” alignment=”center” onclick=”link_image”][vc_column_text]Graphs above compare historical trends of sold prices and rents per-square-foot for Brickell condominiums separated by year when buildings were built. We created 3 main categories: Buildings completed before year 2000, from 2000 to 2015, and after 2015. You can observe significant average price difference between fairly…

Condominium Market Snapshot - Feb 2019 - Main Table

Condominium Neighborhood Market Data – Feb 2019

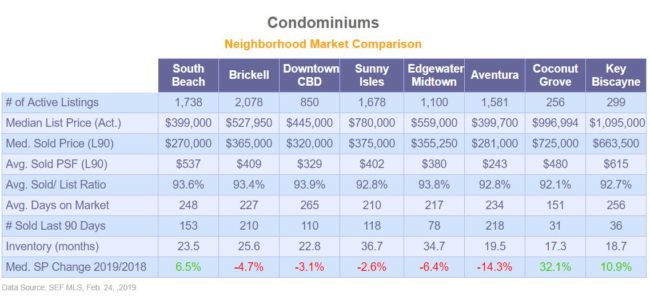
[vc_row][vc_column][vc_single_image image=”195″ img_size=”large” alignment=”center” onclick=”img_link_large”][vc_column_text]There has been an uptick in a number of active condominium listings across the board with a sole exception of South Beach. The largest inventory increase of 7.3% was observed in Sunny Isles which just surpassed 3 years at 36.7 months. Inventory is calculated by dividing the number of active listings…

Single Family Market Snapshot - Feb2019

Single Family Neighborhood Market Data – Feb 2019

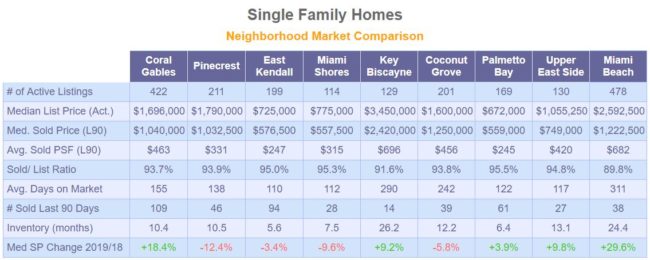
[vc_row][vc_column][vc_single_image image=”223″ img_size=”large” alignment=”center” onclick=”link_image”][vc_column_text]Data Source: SEF MLS, Feb. 15, 2019 Amount of active listings in February increased across all surveyed neighborhoods above by an average of 6.2% with a largest increase in Key Biscayne with a jump of 11.2%. Most significant increases in median asking prices from previous month are in East Kendall (7.4%)…

coral-gables-median-SP-2018-feb2019

Coral Gables & Coconut Grove Sales

[vc_row][vc_column][ultimate_heading main_heading=”Coral Gables & Coconut Grove Sales” heading_tag=”h3″ margin_design_tab_text=””][/ultimate_heading][vc_empty_space height=”16px”][vc_single_image image=”214″ img_size=”large” alignment=”center” onclick=”img_link_large”][vc_single_image image=”215″ img_size=”large” alignment=”center” onclick=”img_link_large”][/vc_column][/vc_row][vc_row][vc_column][vc_column_text]Data Source: SEF MLS, Feb. 15, 2019 Above graphs depict number of closings each month and median sale price in Coral Gables and Coconut Grove from January 2018 to January 2019.[/vc_column_text][/vc_column][/vc_row]

Condominium-Market-Snapshot---TBL-2---Jan-2019

Neighborhood Rental Data – Jan 2019

[vc_row][vc_column][ultimate_heading main_heading=”Neighborhood Rental Data – Jan 2019″ heading_tag=”h3″ margin_design_tab_text=””][/ultimate_heading][vc_empty_space height=”16px”][vc_single_image image=”166″ img_size=”large” alignment=”center” onclick=”img_link_large”][vc_column_text]Table above lists rental data for available apartments in the corresponding neighborhoods as the table at the top of the page. We separated the data to show the median asking rent for furnished and unfurnished units as well as the number of…

Condominiums-Market-Snapshot---TBL-1---Jan-2019

Condominiums Neighborhood Market Data – Jan 2019

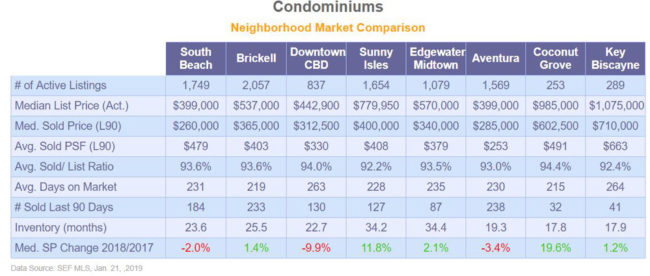
[vc_row][vc_column][vc_single_image image=”170″ img_size=”large” alignment=”center”][vc_column_text]South Beach ended the year with a drop in average sale price per square foot by 9.9% compared to the previous 3-month trailing period but number of available units for sale increased by 5.6% which pushed the inventory level to 23.6 months. Only Downtown and Edgewater have inventory levels higher at 34.2…