ARKUP

ARKUP Luxury Living on the Water

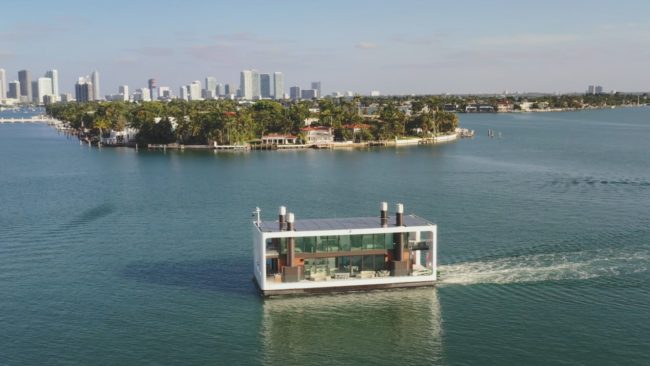
[vc_row][vc_column][vc_column_text]Today I had an opportunity to tour ARKUP which is currently docked in Miami Beach marina. I previously visited the builder while ARKUP #1 was still under construction. It is one of those projects that already looks quite an impressive on a design board but then the idea, money source, and execution properly align and…

email-blast-header---september-2019-single-family-homes

Single Family Market Update – September 2019

[vc_row][vc_column][vc_empty_space height=”20px”][vc_single_image image=”1286″ img_size=”large” alignment=”center” onclick=”link_image”][vc_column_text]Data Source: SEF MLS, September 9, 2019 Number of active single family listings decreased on all surveyed neighborhoods by an average of 10.6% with a sole exception of Key Biscayne where the active listings number increased by 5.2%. Most notable changes in median sale price in the last 90 days…

email-blast-header---june-2019-single-family-homes

Single Family Market Update – June 2019

[vc_row][vc_column][vc_empty_space height=”20px”][vc_single_image image=”1149″ img_size=”large” alignment=”center” onclick=”link_image”][vc_column_text]Data Source: SEF MLS, June 15, ,2019 Number of active listings increased in all markets above except Miami Beach and Upper East Side. Most notable increase took place in Miami Shores and Coral Gables with 24.2% and 22.3% active listing increase from October of 2018. Median asking prices dropped in…

miami-beach,-florida

South Beach Condominiums – Median Sold & Rented Prices – May 2019

[vc_row][vc_column][vc_empty_space height=”20px”][vc_single_image image=”1125″ img_size=”large” alignment=”center” onclick=”link_image”][vc_empty_space height=”20px”][vc_single_image image=”1126″ img_size=”large” alignment=”center” onclick=”link_image”][vc_column_text]Data Source: SEF MLS, May 31, ,2019 The two graphs above compare monthly price trends for waterfront and non-waterfront condominiums in South Beach. The top graph depicts median sale prices for condominiums on the water and inland whereas the graph below shows the same criteria…

email-blast-header---MAY-2019-condominiums

Condominium Market Update – May 2019

[vc_row][vc_column][vc_empty_space height=”20px”][vc_single_image image=”1122″ img_size=”large” alignment=”center” onclick=”link_image”][vc_column_text]Data Source: SEF MLS, May 27, ,2019 Most notable decreases in the last 90-day sold prices have been observed in Sunny Isles and Key Biscayne. While the last 3 months of 2018 the median sold price in Sunny Isles was well over $400,000, the current median sold price dropped to $350,000.…

email-blast-header---may-2019-single-family-homes

Single Family Market Update – May 2019

[vc_row][vc_column][vc_empty_space height=”20px”][vc_single_image image=”1118″ img_size=”large” alignment=”center” onclick=”link_image”][vc_column_text]Data Source: SEF MLS, May 20, ,2019 Inventory levels continue to steadily increase across all surveyed neighborhoods. Following 2 numbers behind each neighborhood represent inventory level as of October of 2018 and inventory level as of May of 2019: Coral Gables (9.2 months, 12.5 months), Pinecrest (10.4 months, 12.5 months),…

email-blast-header---APRIL-2019-condominiums

Condominium Market Update – April 2019

[vc_row][vc_column][vc_empty_space height=”20px”][vc_single_image image=”1031″ img_size=”large” alignment=”center” onclick=”link_image”][vc_column_text]Data Source: SEF MLS, April 22, ,2019 Number of active listings peaked around the end of last year and beginning of this year and has since dropped in all surveyed neighborhoods with the sole exception of Edgewater. Most notable decrease was in South Beach where the number of available condominiums…

email-blast-header---april-2019-single-family-homes

Single Family Market Update – April 2019

[vc_row][vc_column][vc_empty_space height=”20px”][vc_single_image image=”814″ img_size=”large” alignment=”center” onclick=”link_image”][vc_column_text]Data Source: SEF MLS, April 14, ,2019 Let’s start from the bottom of the table and look at inventory levels first. To calculate this number I am using number of sales in the last 365 days, dividing it by 12 to derive at average monthly sales velocity. Then I take…

email-blast-header---MARCH-2019-condominiums

Condominium Market Update – March 2019

[vc_row][vc_column][vc_empty_space height=”20px”][vc_single_image image=”417″ img_size=”large” alignment=”center” onclick=”link_image”][vc_column_text]Data Source: SEF MLS, Mar. 19, ,2019 The largest increase of median sale price in 3-month trailing period year-over-year (Dec-Feb) has been observed in Coconut Grove (15.3%), followed by Key Biscayne (10.6%), and South Beach (8.9%). On the opposite side in the red is Aventura (-12.9%), Edgewater/ Midtown (6.9%), and…

email-blast-header---MARCH-2019-single-family-homes

Single Family Market Update – Mar 2019 (Cont’d)

[vc_row][vc_column][vc_single_image image=”324″ img_size=”large” alignment=”center” onclick=”link_image”][vc_column_text]Data Source: SEF MLS, Mar. 13, 2019 All five surveyed neighborhoods above continue to display decent growth especially the front-runners Little Haiti and Allapattah. Opa Locka and Hialeah lag behind but overall low inventory levels, ongoing strong sales velocities, and high sale/list ratios still make these good investment prospects.[/vc_column_text][/vc_column][/vc_row]