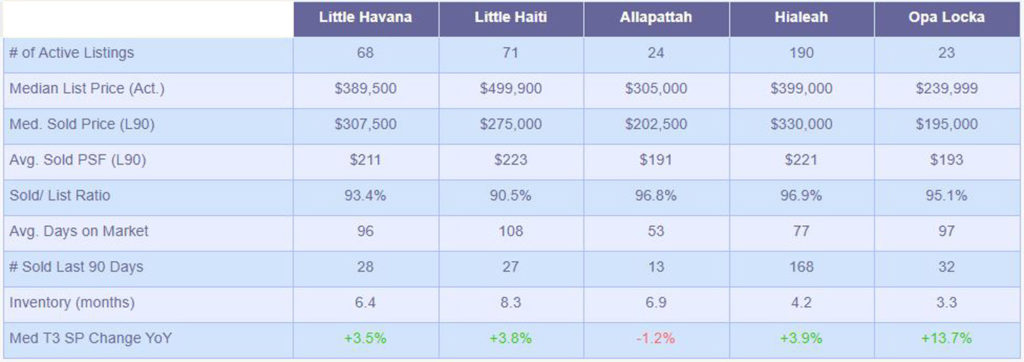
Data Source: SEF MLS, June 15, ,2019
Number of active listings increased in all markets above except Miami Beach and Upper East Side. Most notable increase took place in Miami Shores and Coral Gables with 24.2% and 22.3% active listing increase from October of 2018.
Median asking prices dropped in Coral Gables (-8.2%), Pinecrest (-9.3%), Coconut Grove (-4.6%) and grew in East Kendall (10.6%), Miami Shores (7.3%), and Upper East Side (24.8%) when compared to median listing prices in October of 2018.
Trailing 3-month year-over-year change in median sale price is the most robust in Key Biscayne (17.6%), closely followed by Miami Beach (17.5%), and Upper East Side (12.1%), Coconut Grove (10.7%) and so on. When we compare these numbers to a 2019 year-to-date data and compare it to calendar year 2018 the neighborhood which leads is Miami Beach with 13.8%, followed by Key Biscayne with 10.3%, and Palmetto Bay with 7.2%.
As strong as Key Biscayne’s prices appear to be, somewhat worrisome is the increasing inventory levels which presently stand at 29.6 months. This stands in stark contrast with with all other neighborhoods (sole exception is Miami Beach with 23.6 months albeit decreasing) which have a range of 5.6 to 13.3 months of home inventories.
Data Source: SEF MLS, June 15, ,2019


